Did it really fix it 2: Plan flip, unprofileable, baseline OFE round 2 and “stability”
November 16, 2015 Leave a comment
Snappy title, huh?
Aka: Why a sql plan baseline may be no guarantee of stability.
The other day, a problematic plan flip…
Tangent 1:
Cue much discussion about plan flips etc.
My thoughts on stability are that the priority for most application owners is stability and predictability but that does not tally with the defaul CBO behaviour and potentially you have to turn off a helluva lot to even get close.
Tangent 2:
I have commented before about the common sensitive of many databases to concurrent direct path reads (or rather the sensitivity is on the underlying SAN).
Here is one such illustration caused by this particular plan flip.
See that our single block read times go out from a “normal” range of 5 – 20ms to an average of 50+ ms. At this point anything doing physical IO starts to notice.
(Needless to say, I’m not a fan of these “normal” IO times – I think they’re awful but the SLA of the tier 2 (non flash) SAN storage is 20ms so we don’t alert until we breach that.)
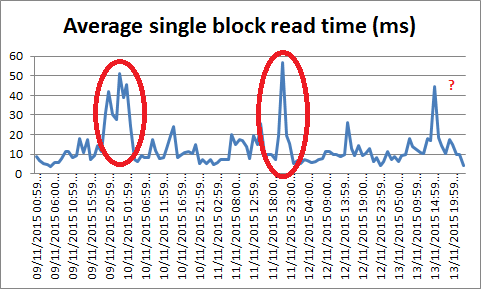
Source:
select snap_id, begin_time, end_time, round(average,2)
from   dba_hist_sysmetric_summary
where  metric_name     = 'Average Synchronous Single-Block Read Latency'
order by snap_id;
Back to reality
Anyway, standard immediate-term fix for a plan flip is to hunt down a better plan from AWR and fix it with a profile or a baseline.
Not a problem to find one for this SQL as it nearly always executed with the same decent plan.
(AWR history is much longer than this but it gives the picture)
select to_char(trunc(sn.end_interval_time),'DD-MON-YYYY') dt
,      st.sql_id
,      st.plan_hash_value
,      sum(rows_processed_delta) rws
,      sum(executions_delta)     execs
,      round(sum(elapsed_time_delta)/1000/1000)   elp
,      round(sum(elapsed_time_delta)/1000/1000/nvl(nullif(sum(executions_delta),0),1),2)   elpe
,      round(sum(iowait_delta)/1000/1000)         io
,      round(sum(cpu_time_delta)/1000/1000)       cpu
,      sum(buffer_gets_delta)    gets
,      round(sum(disk_reads_delta))         disk_reads
from   dba_hist_snapshot sn
,      dba_hist_sqlstat  st
where  st.snap_id            = sn.snap_id
and    sn.instance_number = st.instance_number
and    st.sql_id             IN ('6xrx006fmqbq2')
group by trunc(sn.end_interval_time), st.sql_id, st.plan_hash_value
order by trunc(sn.end_interval_time) desc, elp desc;
DT          SQL_ID        PLAN_HASH_VALUE        RWS      EXECS        ELP       ELPE         IO        CPU       GETS DISK_READS
----------- ------------- --------------- ---------- ---------- ---------- ---------- ---------- ---------- ---------- ----------
10-NOV-2015 6xrx006fmqbq2      3871506300          5       1815     236211     130.14     226340       9993  757853211  745588219
09-NOV-2015 6xrx006fmqbq2      3871506300          1       1232     156412     126.96     149660       6846  507571690  499305166
09-NOV-2015 6xrx006fmqbq2      3803735407         53       6835        743        .11          3        723  190488567         41
07-NOV-2015 6xrx006fmqbq2      3803735407         31       3079        230        .07          3        218   37385043         56
06-NOV-2015 6xrx006fmqbq2      3803735407        166      18931       1200        .06         11       1128  180142678        484
05-NOV-2015 6xrx006fmqbq2      3803735407        305       9904        553        .06          5        508   75239139         93
04-NOV-2015 6xrx006fmqbq2      3803735407        160      18900       1089        .06          9       1027  150523728        204
03-NOV-2015 6xrx006fmqbq2      3803735407        226      12048        859        .07         58        794  154111239        424
02-NOV-2015 6xrx006fmqbq2      3803735407       1081      13327       1276         .1         66       1200  278129234        465
Problem plan is obvious, right?
Started during the day on the 9th, continued overnight until eventually noticed.
PHV 3871506300 does a FTS and gets direct path reads which causes our IO stress.
So, as mentioned, no problem, hint it with a sql profile via COE_XFR_SQL_PROFILE.sql (see Metalink note 215187.1)
But it didn’t work.
Not properly.
See top line.
DT          SQL_ID        PLAN_HASH_VALUE        RWS      EXECS        ELP       ELPE         IO        CPU       GETS DISK_READS
----------- ------------- --------------- ---------- ---------- ---------- ---------- ---------- ---------- ---------- ----------
10-NOV-2015 6xrx006fmqbq2      3353364157         20       4485     114084      25.44          4     111246 2907305774        216
10-NOV-2015 6xrx006fmqbq2      3871506300          5       1815     236211     130.14     226340       9993  757853211  745588219
09-NOV-2015 6xrx006fmqbq2      3871506300          1       1232     156412     126.96     149660       6846  507571690  499305166
09-NOV-2015 6xrx006fmqbq2      3803735407         53       6835        743        .11          3        723  190488567         41
07-NOV-2015 6xrx006fmqbq2      3803735407         31       3079        230        .07          3        218   37385043         56
06-NOV-2015 6xrx006fmqbq2      3803735407        166      18931       1200        .06         11       1128  180142678        484
05-NOV-2015 6xrx006fmqbq2      3803735407        305       9904        553        .06          5        508   75239139         93
04-NOV-2015 6xrx006fmqbq2      3803735407        160      18900       1089        .06          9       1027  150523728        204
03-NOV-2015 6xrx006fmqbq2      3803735407        226      12048        859        .07         58        794  154111239        424
02-NOV-2015 6xrx006fmqbq2      3803735407       1081      13327       1276         .1         66       1200  278129234        465
We didn’t get “good” plan PHV 3803735407, we avoided “nasty” plan PHV 3871506300 but we got not-quite-so-nasty-but-still-not-nice PHV 3353364157.
The SQL Profile was not able to reproduce the desired PHV.
But at least PHV was not doing the problematic direct path reads!
I took the hints from PHV 3803735407 via
select * from table(dbms_xplan.display_awr('6xrx006fmqbq2',3803735407,format=>'+OUTLINE'));
I double checked they matched the hints in the SQL Profile – they did.
I tried using the hints manually in a SQL statement and the result was consistent with the SQL Profile – PHV 3353364157.
At this point, the DBA suggested using a SQL Plan Baseline.
I resisted but eventually gave in.
Why would it make any difference?
When a plan cannot be reproduced then there are good reasons why a baseline is much, much safer than a profile.
A baseline must reproduce the desired PHV or it will be rejected completely.
A profile has no knowledge of PHV so it is possible that under certain circumstances the hints in a profile may be only partially applied.
Profile was dropped and baseline was created.
This was the immediate aftermath (top line)… Success!
And V$SQL was showing that the baseline was being used.
DT          SQL_ID        PLAN_HASH_VALUE        RWS      EXECS        ELP       ELPE         IO        CPU       GETS DISK_READS
----------- ------------- --------------- ---------- ---------- ---------- ---------- ---------- ---------- ---------- ----------
10-NOV-2015 6xrx006fmqbq2      3803735407          4       1866        120        .06          1        116   17401768         30
10-NOV-2015 6xrx006fmqbq2      3353364157         20       4485     114084      25.44          4     111246 2907305774        216
10-NOV-2015 6xrx006fmqbq2      3871506300          5       1815     236211     130.14     226340       9993  757853211  745588219
09-NOV-2015 6xrx006fmqbq2      3871506300          1       1232     156412     126.96     149660       6846  507571690  499305166
09-NOV-2015 6xrx006fmqbq2      3871506300          1       1232     156412     126.96     149660       6846  507571690  499305166
09-NOV-2015 6xrx006fmqbq2      3803735407         53       6835        743        .11          3        723  190488567         41
07-NOV-2015 6xrx006fmqbq2      3803735407         31       3079        230        .07          3        218   37385043         56
06-NOV-2015 6xrx006fmqbq2      3803735407        166      18931       1200        .06         11       1128  180142678        484
05-NOV-2015 6xrx006fmqbq2      3803735407        305       9904        553        .06          5        508   75239139         93
04-NOV-2015 6xrx006fmqbq2      3803735407        160      18900       1089        .06          9       1027  150523728        204
03-NOV-2015 6xrx006fmqbq2      3803735407        226      12048        859        .07         58        794  154111239        424
02-NOV-2015 6xrx006fmqbq2      3803735407       1081      13327       1276         .1         66       1200  278129234        465
I maintained that this didn’t make sense but the ticket was closed so I couldn’t get an SPM trace.
At this point a copy of the statement without profile and without baseline and without the manual fullset of hints was returning the original PHV 3803735407.
I went away that night and on the train I had a thought: “what if it wasn’t round 1 of the baseline which worked but round 2”.
Reminder of the baseline reproduction system
Round 2 is OFE only.
Doesn’t matter whether it is round 1 or round 2, if it’s reproduced it’s reproduced.
But if it was under OFE only then that was no guarantee of stability.
Then the following night, late night call, the baseline was no longer reproducing PHV 3803735407 but was back to the big problem PHV 3871506300!
Although I didn’t have an SPM trace, I’m adamant it verified my theory about it being round 2 only.
DT          SQL_ID        PLAN_HASH_VALUE        RWS      EXECS        ELP       ELPE         IO        CPU       GETS DISK_READS
----------- ------------- --------------- ---------- ---------- ---------- ---------- ---------- ---------- ---------- ----------
11-NOV-2015 6xrx006fmqbq2      3871506300          0        471      80513     170.94      77936       2543  193096137  188992511
11-NOV-2015 6xrx006fmqbq2      3803735407        212       9933        690        .07         14        586   97253038        154
10-NOV-2015 6xrx006fmqbq2      3803735407          4       1866        120        .06          1        116   17401768         30
10-NOV-2015 6xrx006fmqbq2      3353364157         20       4485     114084      25.44          4     111246 2907305774        216
10-NOV-2015 6xrx006fmqbq2      3871506300          5       1815     236211     130.14     226340       9993  757853211  745588219
09-NOV-2015 6xrx006fmqbq2      3871506300          1       1232     156412     126.96     149660       6846  507571690  499305166
09-NOV-2015 6xrx006fmqbq2      3871506300          1       1232     156412     126.96     149660       6846  507571690  499305166
09-NOV-2015 6xrx006fmqbq2      3803735407         53       6835        743        .11          3        723  190488567         41
07-NOV-2015 6xrx006fmqbq2      3803735407         31       3079        230        .07          3        218   37385043         56
06-NOV-2015 6xrx006fmqbq2      3803735407        166      18931       1200        .06         11       1128  180142678        484
05-NOV-2015 6xrx006fmqbq2      3803735407        305       9904        553        .06          5        508   75239139         93
04-NOV-2015 6xrx006fmqbq2      3803735407        160      18900       1089        .06          9       1027  150523728        204
03-NOV-2015 6xrx006fmqbq2      3803735407        226      12048        859        .07         58        794  154111239        424
02-NOV-2015 6xrx006fmqbq2      3803735407       1081      13327       1276         .1         66       1200  278129234        465
Note that at times of change, no database structures were being changed.
Stats will have been gathered, sure – that was the agent of change no doubt.
But no index maintenance was happening, nothing was going unusable, no partition maintenance was happening.
Nothing was changing which should mean that a particular plan was impossible.
This means that the set of hints for this particular plan was not deterministic or rather the hintset was surely incomplete in some way which mean that the optimizer was free to do certain transformations which meant that the hintset was then invalid? Not 100% sure, still to be looked at in more detail…
At this point we dropped the baseline and went with a cut-down sql profile which applied only two hints – to politely request index scans for the two problematic FTS in each of PHV 3871506300 and 3353364157.
And this worked and has been ok since (so far) but it will not be the longer term solution.
DT          SQL_ID        PLAN_HASH_VALUE        RWS      EXECS        ELP       ELPE         IO        CPU       GETS DISK_READS
----------- ------------- --------------- ---------- ---------- ---------- ---------- ---------- ---------- ---------- ----------
16-NOV-2015 6xrx006fmqbq2      3803735407         80       6887        348        .05         11        310   44574494         86
13-NOV-2015 6xrx006fmqbq2      3803735407        114      13054        842        .06         19        713  117260543        482
12-NOV-2015 6xrx006fmqbq2      3803735407        585      28074       1854        .07         12       1823  321890748       1983
11-NOV-2015 6xrx006fmqbq2      3871506300          0        471      80513     170.94      77936       2543  193096137  188992511
11-NOV-2015 6xrx006fmqbq2      3803735407        212       9933        690        .07         14        586   97253038        154
10-NOV-2015 6xrx006fmqbq2      3871506300          5       1815     236211     130.14     226340       9993  757853211  745588219
10-NOV-2015 6xrx006fmqbq2      3353364157         20       4485     114084      25.44          4     111246 2907305774        216
10-NOV-2015 6xrx006fmqbq2      3803735407          4       1866        120        .06          1        116   17401768         30
09-NOV-2015 6xrx006fmqbq2      3871506300          1       1232     156412     126.96     149660       6846  507571690  499305166
09-NOV-2015 6xrx006fmqbq2      3803735407         53       6835        743        .11          3        723  190488567         41
07-NOV-2015 6xrx006fmqbq2      3803735407         31       3079        230        .07          3        218   37385043         56
06-NOV-2015 6xrx006fmqbq2      3803735407        166      18931       1200        .06         11       1128  180142678        484
05-NOV-2015 6xrx006fmqbq2      3803735407        305       9904        553        .06          5        508   75239139         93
04-NOV-2015 6xrx006fmqbq2      3803735407        160      18900       1089        .06          9       1027  150523728        204
03-NOV-2015 6xrx006fmqbq2      3803735407        226      12048        859        .07         58        794  154111239        424
02-NOV-2015 6xrx006fmqbq2      3803735407       1081      13327       1276         .1         66       1200  278129234        465
Never before seen an execution plan which had quite this problem interacting with SPM.
A test case to get to the root of the problem is still on the TODO list.
Something to do with a statement involving a WITH subquery and NO_MERGE
e.g.
WITH x AS (SELECT /*+ no_merge...)
SELECT
FROM ...
WHERE EXISTS (SELECT
              FROM   x
              ...
              WHERE...);


Recent Comments